> ## Documentation Index
> Fetch the complete documentation index at: https://docs.withrealm.com/llms.txt
> Use this file to discover all available pages before exploring further.
# Analytics
> Track usage, activity, and engagement across your organization
The Analytics dashboard shows how your team uses Realm. Navigate to **Settings** > **Analytics** in the sidebar. The page has two tabs: **Usage data** and **Reports**.
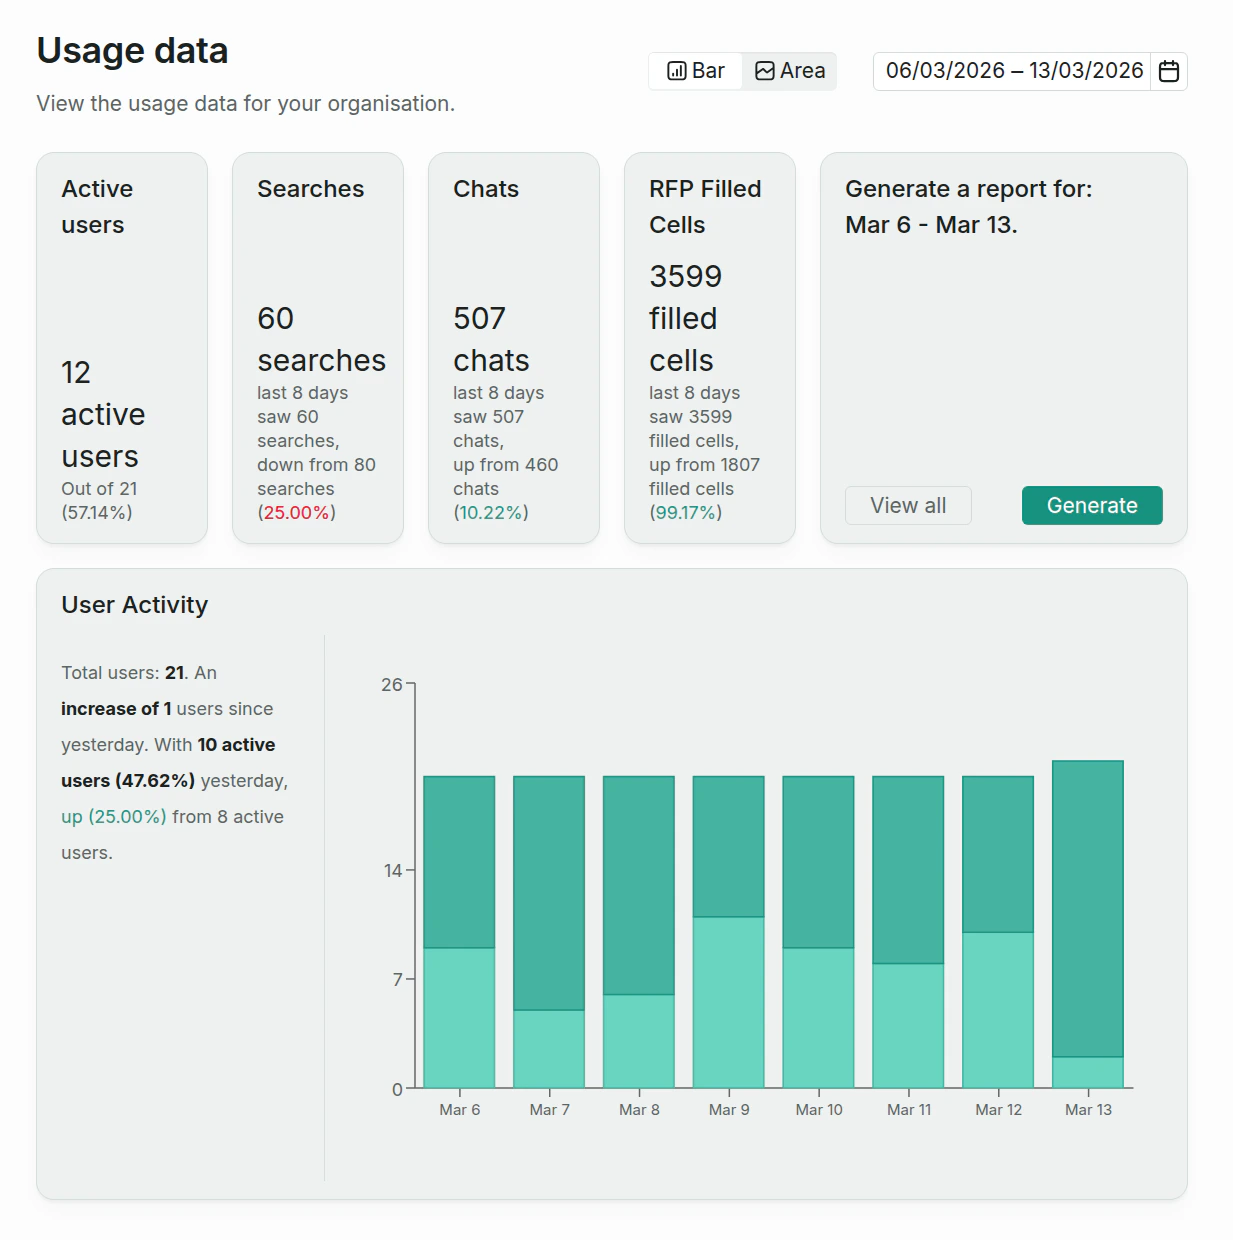 On the **Usage data** tab, your metrics sit in a row across the top of a single card. Click any metric to see its chart below. Use the date range picker and chart type button above the card to change the time window and switch between **Bar** and **Area** charts.
Each metric shows the current value. When comparable data exists, it also shows the percentage change from the equivalent previous period (e.g. selecting the last 7 days compares against the 7 days before that). An up or down arrow and color show the direction of the change.
## Metrics
| Metric | What it measures |
| -------------------- | --------------------------------------------------------------------------------------- |
| **Active Users** | Unique active users out of the users who were members at the end of the selected period |
| **Searches** | Total search queries |
| **Chats** | Total chat messages across Web, Slack, API, MCP, and Workflow |
| **RFP Filled Cells** | Total RFP cells filled |
## User activity
When you select the **Active Users** metric, the User Activity section shows a daily breakdown of active vs. inactive users as a stacked chart. Each day uses the membership at the end of that day, so removing a member does not change earlier historical totals.
## Chat activity
When you select the **Chats** metric, **Chats by type** breaks down activity across Web, Slack, API, MCP, and Workflow. **Chats by agent** also appears when agent activity reporting is enabled and data is available.
## Reports
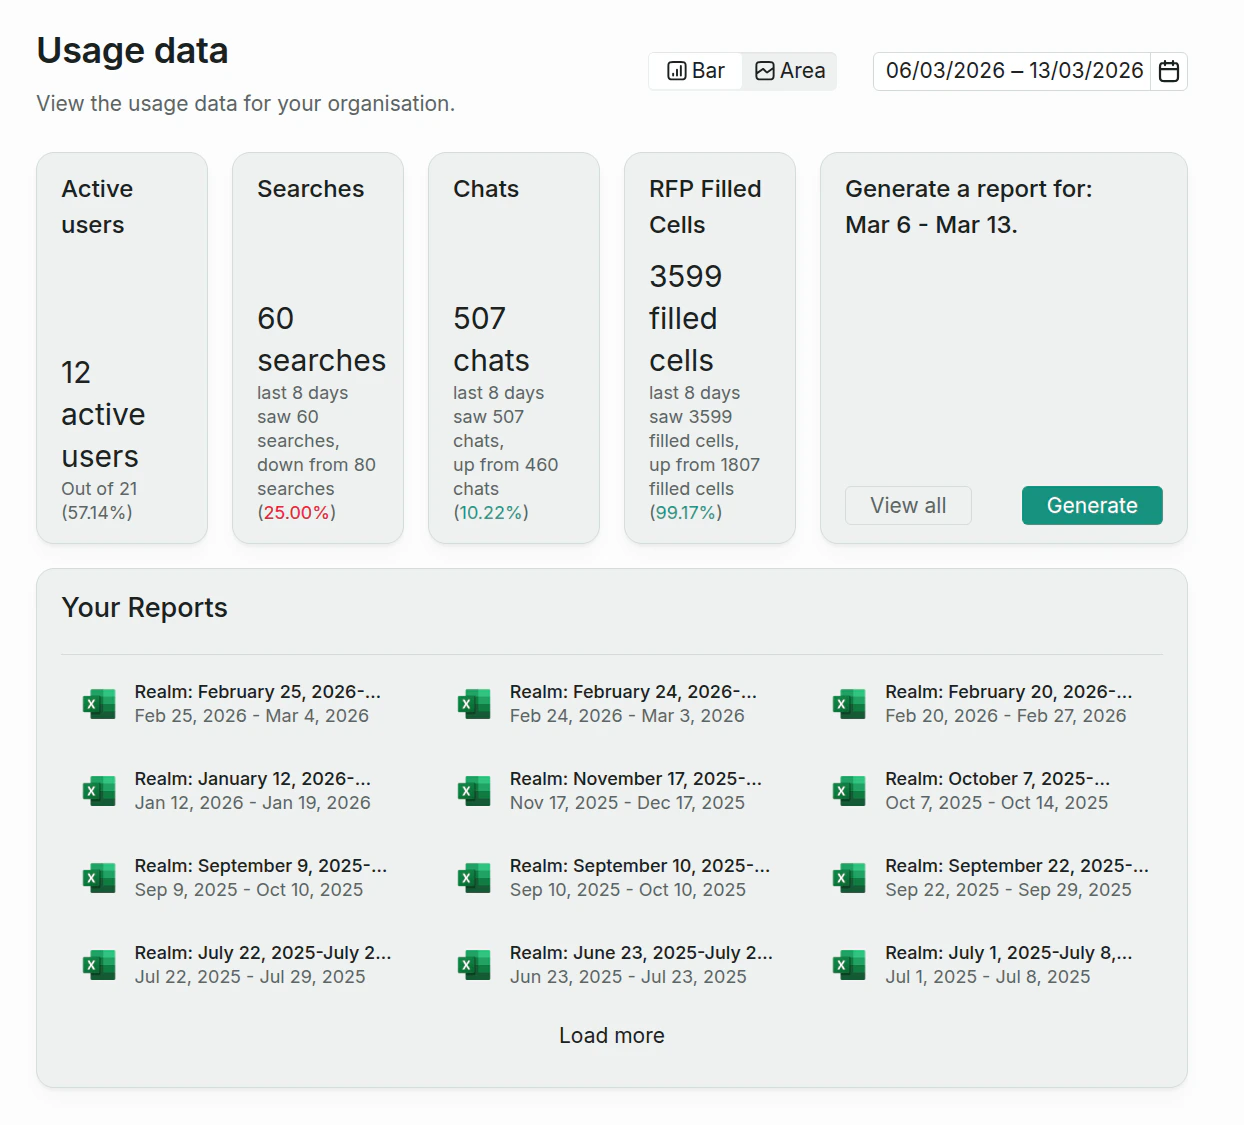
Switch to the **Reports** tab at the top of the page. Reports are Excel (`.xlsx`) workbooks containing overall usage data. Depending on your organization's configuration, they can also include user, query, and agent activity breakdowns for the selected date range.
To generate a report, pick a date range and click **Generate**. The report downloads automatically. Previously generated reports are listed below and can be re-downloaded at any time.
On the **Usage data** tab, your metrics sit in a row across the top of a single card. Click any metric to see its chart below. Use the date range picker and chart type button above the card to change the time window and switch between **Bar** and **Area** charts.
Each metric shows the current value. When comparable data exists, it also shows the percentage change from the equivalent previous period (e.g. selecting the last 7 days compares against the 7 days before that). An up or down arrow and color show the direction of the change.
## Metrics
| Metric | What it measures |
| -------------------- | --------------------------------------------------------------------------------------- |
| **Active Users** | Unique active users out of the users who were members at the end of the selected period |
| **Searches** | Total search queries |
| **Chats** | Total chat messages across Web, Slack, API, MCP, and Workflow |
| **RFP Filled Cells** | Total RFP cells filled |
## User activity
When you select the **Active Users** metric, the User Activity section shows a daily breakdown of active vs. inactive users as a stacked chart. Each day uses the membership at the end of that day, so removing a member does not change earlier historical totals.
## Chat activity
When you select the **Chats** metric, **Chats by type** breaks down activity across Web, Slack, API, MCP, and Workflow. **Chats by agent** also appears when agent activity reporting is enabled and data is available.
## Reports
Switch to the **Reports** tab at the top of the page. Reports are Excel (`.xlsx`) workbooks containing overall usage data. Depending on your organization's configuration, they can also include user, query, and agent activity breakdowns for the selected date range.
To generate a report, pick a date range and click **Generate**. The report downloads automatically. Previously generated reports are listed below and can be re-downloaded at any time.