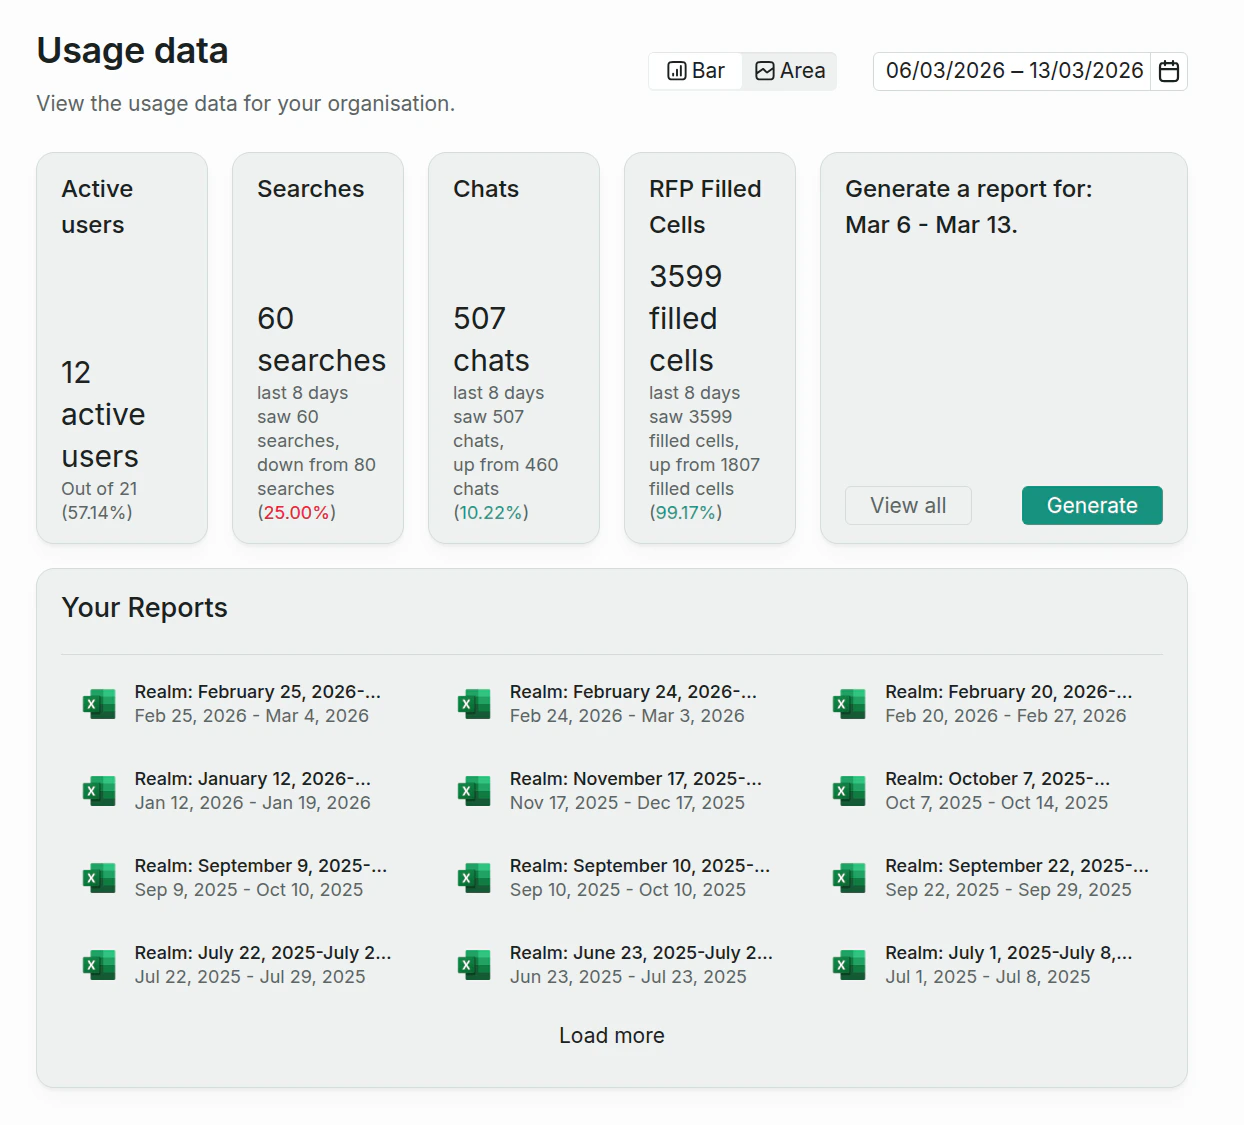
Metrics
| Metric | What it measures |
|---|---|
| Active Users | Unique users who used Realm in the selected period |
| Searches | Total search queries |
| Chats | Total chat messages (web and Slack combined) |
| RFP Filled Cells | Total RFP cells processed |
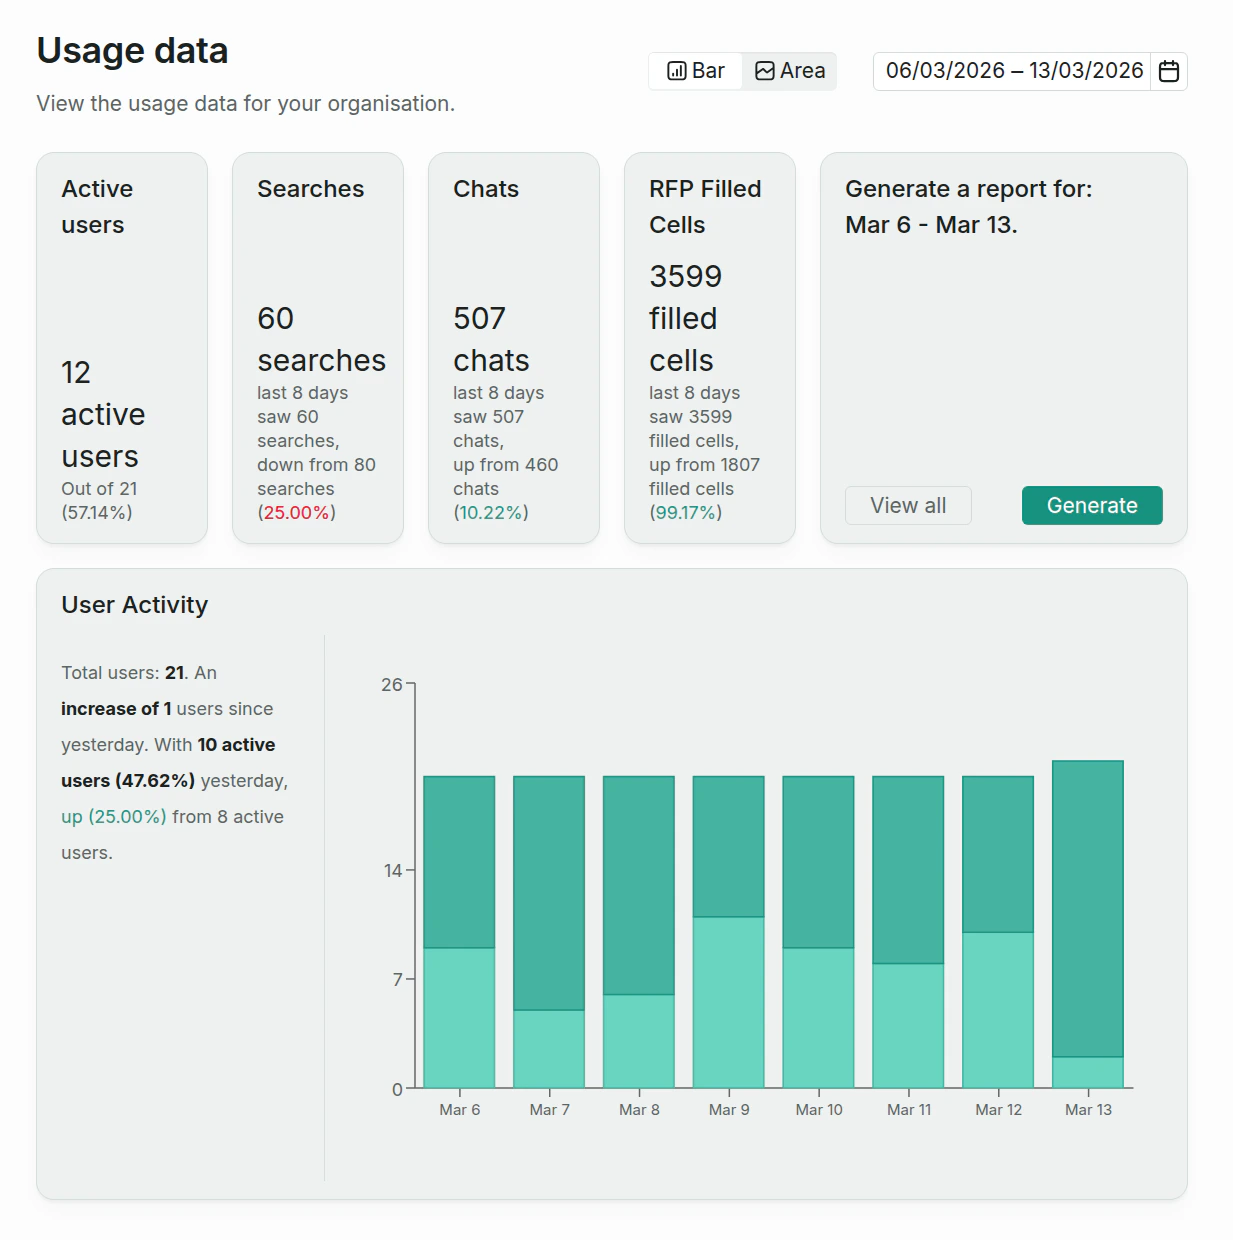
User activity
When you select the Active Users card, the User Activity section shows a daily breakdown of active vs. inactive users as a stacked chart, alongside a text summary with total user count, growth since the previous period, and active user percentage.Reports
Click the Reports card to generate and view reports. Reports provide per-user and per-query breakdowns for the selected date range. To generate a report, click Generate on the reports card. The report downloads automatically as a CSV. Previously generated reports are listed under Your Reports and can be re-downloaded at any time.